Hammer
The Hammer is one of the most reliable and recognizable bullish reversal patterns in candlestick analysis.
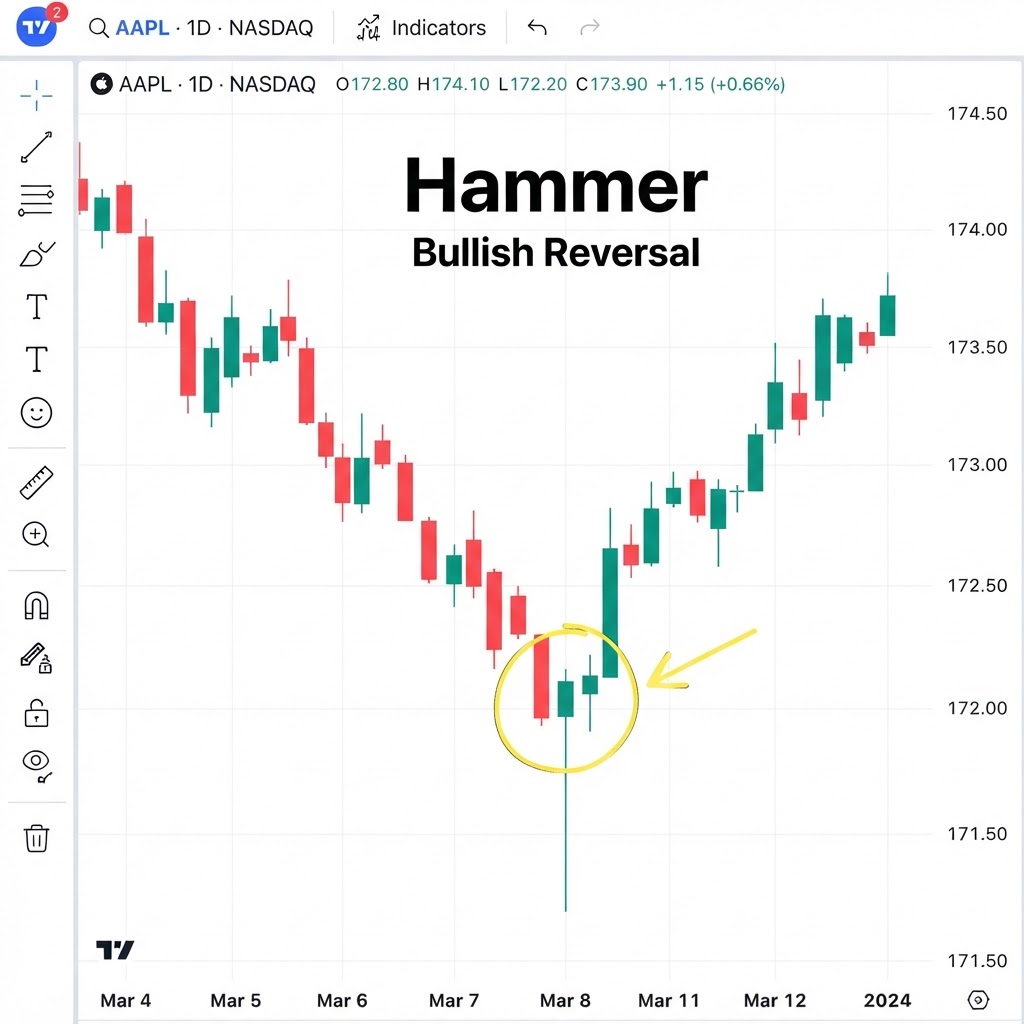
Realistic chart representation
Look for this pattern at the end of a consolidated downtrend, preferably on a key support level. Do not trade against the long-term trend.
What is the Hammer pattern?
The Hammer is one of the most reliable and recognizable bullish reversal patterns in candlestick analysis. It appears at the end of a downtrend and is characterized by a small body at the top of the candle and a long lower shadow that must be at least 2-3 times the body length. The upper shadow is absent or minimal. The meaning is clear: during the session, sellers pushed price very low, but buyers reacted strongly bringing price back near the opening highs. This 'rejection' of low price is the signal that selling pressure is exhausting.
How do you trade Hammer?
Why does the Hammer pattern work?
The Hammer derives its name from its visual resemblance to a hammer striking the bottom of a downtrend. In Japanese candlestick theory, this pattern is classified as a 'reversal alert' — it warns that the prevailing bearish momentum is losing steam. The critical element is the ratio between the lower shadow and the body: a minimum of 2:1 is required, but the most powerful Hammers show ratios of 3:1 or even 4:1. The longer the lower shadow, the more violent the rejection of lower prices and the more significant the psychological message.
It's essential to understand that the Hammer is a contextual pattern — its meaning depends entirely on where it appears. A Hammer in the middle of a sideways range is just noise. A Hammer at the confluence of a horizontal support, a Fibonacci 61.8% retracement, and a moving average is one of the highest-probability setups in all of technical analysis. Context transforms a simple candle into a professional-grade signal.
Another often-overlooked aspect is the body position. The body should be in the upper third of the candle's trading range. If the body is centered or in the lower third, the pattern is weaker and closer to a 'Doji' or 'High-Wave' candle, which carry different implications. The color of the body (green vs red) is secondary, but a green Hammer is slightly more bullish because it shows the session closed above its opening.