Shooting Star
The Shooting Star is the opposite of the Inverted Hammer: same shape, opposite context.
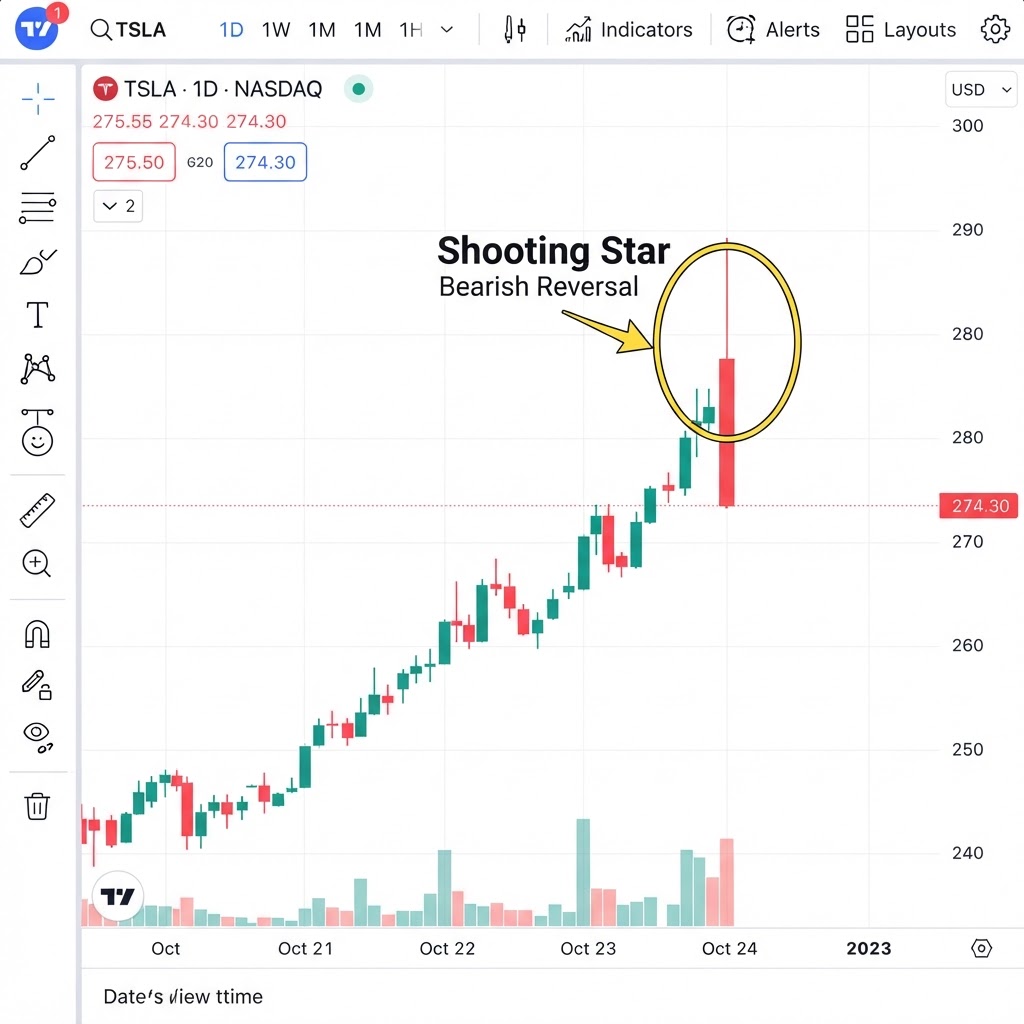
Realistic chart representation
Look for this pattern at the end of a consolidated uptrend, preferably on a key resistance level. Do not trade against the long-term trend.
What is the Shooting Star pattern?
The Shooting Star is the opposite of the Inverted Hammer: same shape, opposite context. It forms at the end of an uptrend and is characterized by a small body at the bottom of the candle and a long upper shadow (at least 2-3x the body). Open and close are close together, and the lower shadow is minimal. It indicates that during the session buyers pushed price very high but sellers reacted strongly bringing price back toward the lows — the first signal that the uptrend is exhausting.
How do you trade Shooting Star?
Why does the Shooting Star pattern work?
The Shooting Star is a bearish reversal pattern that appears at the end of an uptrend. It's the bearish counterpart of the Inverted Hammer: a small body at the bottom of the candle with a long upper shadow (at least 2x the body) and minimal or no lower shadow. The pattern indicates that buyers pushed price to new highs during the session but were aggressively rejected by sellers, who pushed price back down to close near the session's low.
The Shooting Star is a powerful signal because it represents a failed bullish breakout. The long upper shadow shows that buyers attempted to extend the uptrend but met overwhelming selling pressure. The close near the low confirms that sellers won the session's battle. When this pattern appears at a key resistance level, especially after an extended uptrend, it's one of the most reliable bearish reversal signals.
The pattern's reliability increases with: (1) the length of the upper shadow (longer = stronger rejection), (2) the position on a key resistance, (3) above-average volume (confirms the selling pressure), (4) the overall uptrend's maturity (the longer the preceding uptrend, the more significant the reversal). Confirmation is recommended: the next candle should close below the Shooting Star's body to validate the reversal.