Doji
The Doji is a candle where open and close are practically identical, creating a tiny or non-existent body with shadows above and/or below.
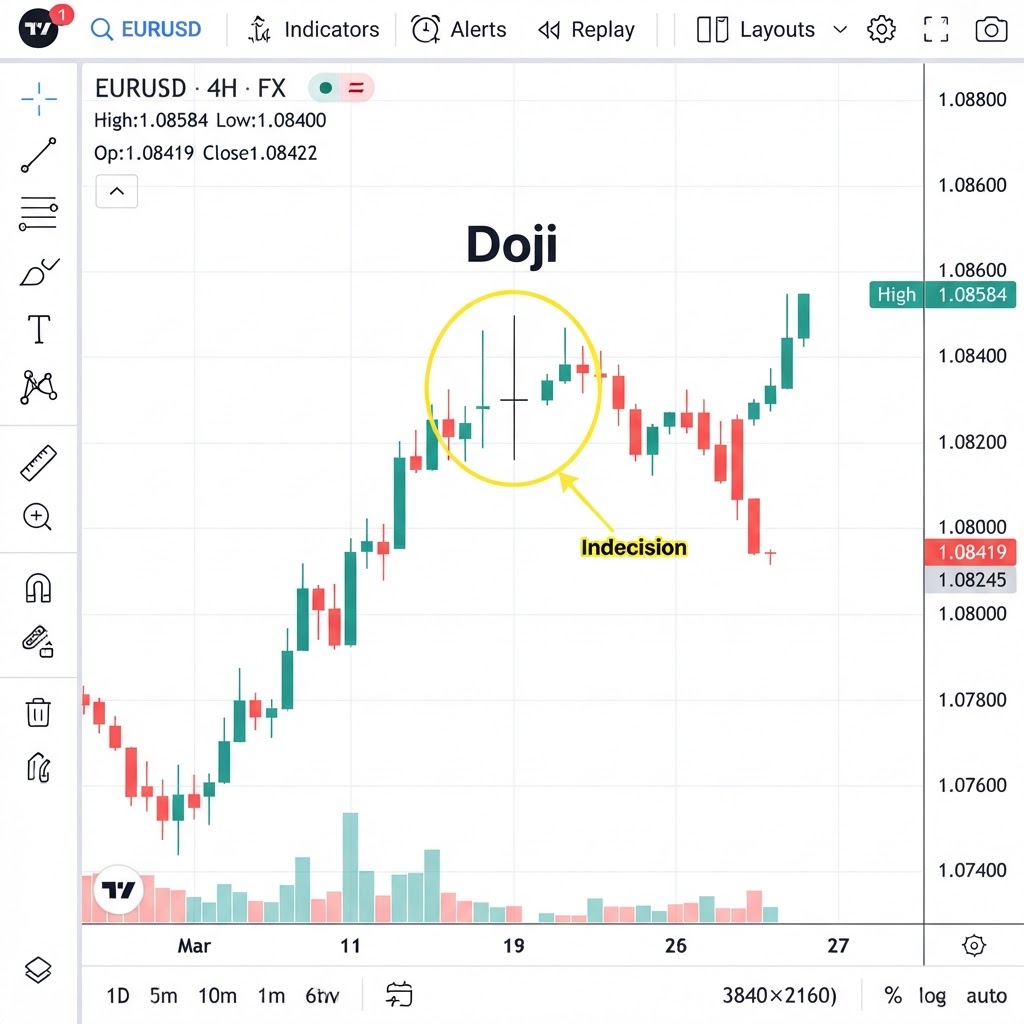
Realistic chart representation
Look for this pattern at the end of a consolidated uptrend, preferably on a key resistance level. Do not trade against the long-term trend.
What is the Doji pattern?
The Doji is a candle where open and close are practically identical, creating a tiny or non-existent body with shadows above and/or below. It represents the perfect balance between buyers and sellers during the session — neither won the battle. Alone it's neither bullish nor bearish: its meaning depends entirely on the context in which it appears.
How do you trade Doji?
Why does the Doji pattern work?
The Doji is a candlestick pattern where the opening and closing prices are virtually identical, creating a cross or plus-sign shape. The body is extremely small (or nonexistent), and the shadows can vary in length. The Doji represents indecision — neither buyers nor sellers could gain control during the session, and the market closed essentially where it opened.
The Doji's significance depends entirely on context. In a sideways market, a Doji is just noise — it shows the ongoing indecision that characterizes a range. In a strong uptrend, a Doji can signal that buyers are losing momentum — a potential reversal warning. In a strong downtrend, a Doji can signal that sellers are losing momentum — also a potential reversal warning. The key is that the Doji alone is not a signal — it's the context that gives it meaning.
There are several types of Doji: (1) Standard Doji — small body in the middle of the candle, shadows of similar length. (2) Long-Legged Doji — long shadows on both sides, showing high volatility but no resolution. (3) Dragonfly Doji — small body at the top, long lower shadow (similar to a Hammer). (4) Gravestone Doji — small body at the bottom, long upper shadow (similar to a Shooting Star). (5) Four-Price Doji — open, high, low, and close are all the same (extremely rare, shows complete inactivity).
The Doji is most significant when: (1) it appears after an extended trend (uptrend or downtrend), (2) it forms at a key support/resistance level, (3) it has above-average volume (shows real participation despite the indecision), (4) it's confirmed by a reversal candle in the next session. A Doji in the middle of nowhere, in a sideways market, with no volume, is just noise and should be ignored.
The Doji is a warning, not a signal. It tells you that the market is undecided — but it doesn't tell you which way the decision will go. Wait for the next candle to confirm the direction before entering. The Doji is the question; the next candle is the answer.